Configuring flow export: Difference between revisions
No edit summary |
No edit summary |
||
| (91 intermediate revisions by the same user not shown) | |||
| Line 2: | Line 2: | ||
== Introduction == | == Introduction == | ||
Correct configuration of Flow Exporting Devices (FED) is key to Flow Based Network Analysis. | Correct configuration of Flow Exporting Devices (FED) is key to Flow Based Network Analysis. Mistakes made during configuration will result in missing and duplicated data. They are difficult to identify. Vendors of network equipment are not making it easy as many of them are using some sort of proprietary method to enable flow export on their devices. | ||
Furthermore, | Furthermore, Flow Collector (FC) and FED must allign on configuration parameters in order to interpret the records correctly. | ||
This article | This article creates a vendor independant framework to configure flow exports. We hope it will help you to confgure your FED. | ||
<span style="background-color:#FFFF00;">We ask you kindly to read the entire article and not to jump to the confuration examples towards the end.</span> | |||
For a complete overview of IP Flow Information eXchange (IPFIX), we recommend reading [https://tools.ietf.org/html/rfc3917 RFC 3917]. | |||
If you come aware of vendor specific issues thay may help others, please [mailto:wiki@comcert.com let us know]. | |||
| | ||
| Line 14: | Line 20: | ||
=== Definitions === | === Definitions === | ||
==== Flow ==== | First, let us make sure we speak the same language. | ||
==== Flow Enabled Device or Flow Exporter ==== | |||
''Flow Enabled Device'' of ''Flow Exporter'' is a device configured to send flow records to one or more collectors. This can be a L2 or L3 device. | |||
==== Flow or IP Flow ==== | |||
''Flow'' is formed by all packets between two TCP/IP sockets. Therefore, what we call a TCP sessions consists of two flows: one flow from client to server and the second flow from server to client. | |||
==== Flow record ==== | ==== Flow record ==== | ||
''Flow record'' contains information about a specific flow that was metered at an observation point. A flow record contains measured properties aggregated for the flow. Key record fields are source and destination IP addess, protocol, source and destination port, number of bytes, number of packets, duration and input and output interfaces. There could be many more. | |||
==== Sensor ==== | ==== Sensor ==== | ||
''Sensor'' is a metering point in the device. Sensors are associated with interfaces. It will quantify and qualify packets in or out of that interface, leading to the creation of a flow record decribing the flow. It is very important to realize a sensor will measure packets in one direction only (ingress or egress). | |||
==== Collector ==== | |||
Flow ''collector'' is a server application that receives the flow records and stores them in a database. In TruView, TruView Flow is the collector. In nGeniusONE, the Flow Collector is the collector. The sizeof the hardware will depend on the number of flows received per second and the aging time of the "raw" flow records. | |||
==== Reporter ==== | |||
Flow ''reporter'' is a server application mining the data records, producing tables and charts and possibly alerts. In TruView, TruView Central is the reporter. In nGeniusONE, nGenius Server is the reporter. When the number of flows received per second is low (<50k/s), collector and reporter can be installed on the same hardware. | |||
| |||
=== Global configuration === | |||
The way to enable flow monitoring and flow exports will vary from vendor to vendor. In general there are two major portions. In Global Setting you set parameters on the flow and the export mechanism itself. Interface Settings let you decide where to deploy sensors so that all flows through the device are accounted for. | |||
==== Destination ==== | |||
*IP address of the collector | |||
==== Port ==== | |||
*UDP port where the collector is listening on | |||
==== Active flow timeout ==== | |||
*Interval at which flow record updates are send in case of long flows. A flow is considered long when it exceeds the smallest database granularit. Consequently, this setting should match the smallest granularity of the database on the collector. In most cases, this is one minute or 60 seconds. | |||
==== Inactive flow timeout ==== | |||
*Interval of inactivity (no packets) that marks a flow as inactive. The recommended setting is 15 seconds. | |||
==== Flow record format ==== | |||
With the introduction of CISCO Flexible NetFlow and the standardization of IPFIX, the PDU of a flow record is no longer uniquely defined. The fields contained in the PDU should match the reporter's capabilities of reporting on the value represented in that field. These fields should be present at all times: | |||
*source address | |||
*destination address | |||
*type of service | |||
*protocol | |||
*source port | |||
*destination port | |||
*input interface | |||
*output interface | |||
*tcp flags | |||
*number of bytes | |||
*number of packets | |||
*timestamp of the first packet of the flow | |||
*timestamp of the last packet of the flow | |||
Additional fields may be required in case of [[Sampled_NetFlow|sampling]] or to help indicating the in and out interfaces on a L2 device. | |||
| |||
=== Interface configuration === | |||
| |||
{{#invoke:Message box|ambox |type=info|text=If this is your first experience with configuring flow export on network devices, we recommend you make a drawing of the device, its interfaces (physical and virtual) and every flow that goes through the device.}} | |||
| |||
Basically, this is the science of deploying sensors so that <span style="background-color:#FFFF00">EVERY flow that goes through the device is metered once and </span><span style="background-color:#FFFF00">NO flow is metered more than once</span>. | |||
==== Example 1: ingress sensor on all interfaces ==== | |||
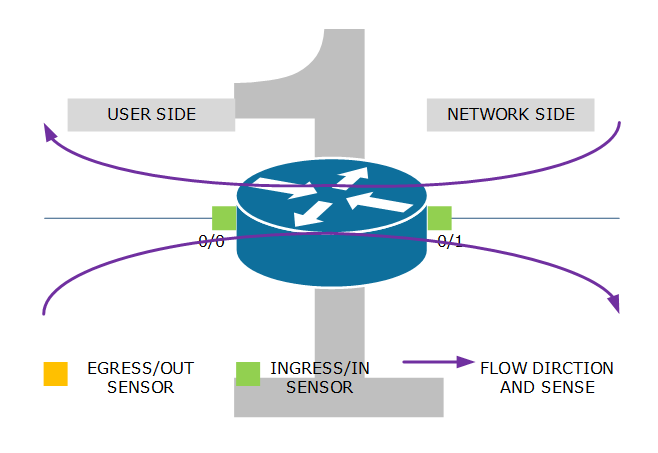
Flows from user to network are metered by the ingress sensor on interface 0/0 while flows from network to user are metered by the ingress sensor on interface 0/1. If the device has more than two active interfaces, deploy ingress sensors on all these interface. | |||
| |||
[[File:2ArmedRouterNIUI.png|border|center|2ArmedRouterNIUI.png]] | |||
| |||
==== Example 2: egress sensor on all interfaces ==== | |||
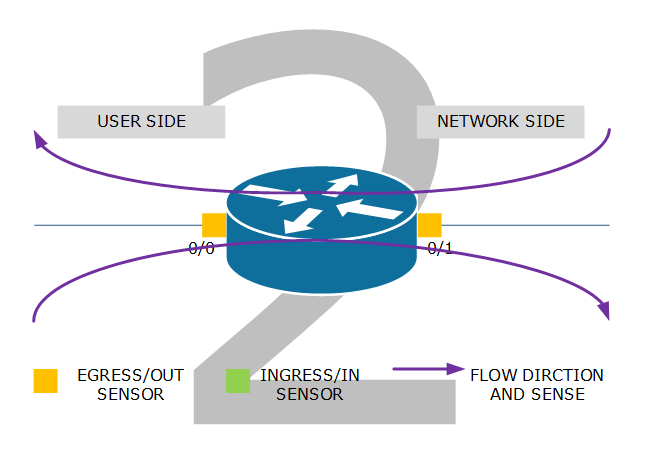
Flows from user to network are metered by the egress sensor on interface 0/1 while flows from network to user are metered by the egress sensor on interface 0/0. If the device has more than two active interfaces, deploy egress sensors on all these interface. | |||
| |||
[[File:2ArmedRouterNEUE.png|border|center|2ArmedRouterNEUE.png]] | |||
| |||
==== Example 3 and 4: ingress and egress sensors on some interfaces ==== | |||
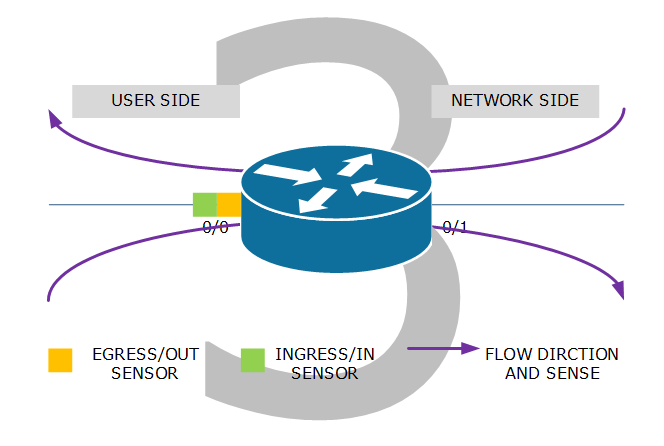
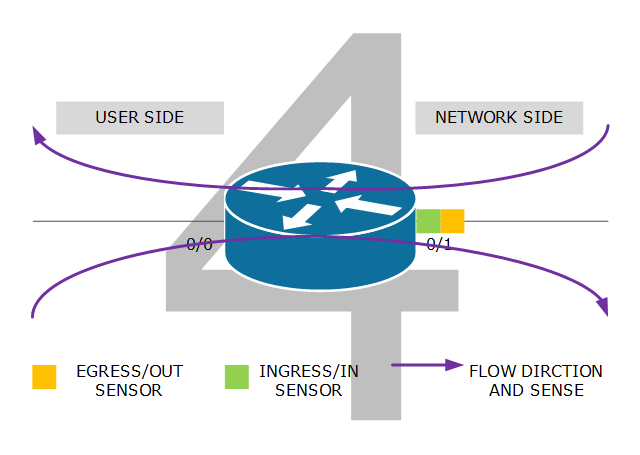
In example 3, flows from user to network are metered by the ingress/in sensor on interface 0/0. Flows from network to user are metered by the egress sensor on that same interface 0/0. This configuration is prefrerable when interface 0/1 is complex like a composed of a multitude of virtual interfaces. In some vendors it may also be required when the network side is a tunnel interface. | |||
It is the method preferred by network service providers as they only "care" about the wide area interface. In that case, sensors will be deployed on the network side of the router. | |||
As a general rule of thumb, this method should not be used on more than one interfaces when these are carying the same flow. | |||
| |||
[[File:2ArmedRouterUIE.png|border|center|2ArmedRouterUIE.png]] | |||
[[File:2ArmedRouterNIE.png|border|center|2ArmedRouterNIE.png]] | |||
| |||
=== Cisco NetFlow Configuration Example === | |||
| |||
[[File:CiscoFlowExample.png|border|center|CiscoFlowExample.png]] | |||
| |||
This is how Flexible NetFlow configuration (without [[Sampled_NetFlow|sampling]]) would look on a CISCO 4000 Series ISR router with a recent IOS. The router has two physical interfaces (20 and 10Mbps) facing the network. At no point in time there is traffic between these two interfaces. | |||
To avoid manual set-up of the interfaces in the collector, the collector must be able to discover the device's configuration using SNMP (read-only). Also, you need to set the correct speed (unspecified line rate or commited interface rate) for the circuits behind the physical interfaces to allow correct calculation of interface utilization. | |||
On devices handling a lot of traffic, you may be required to increase the size of the cache. This will consume additional memory on the device. | |||
==== Global settings ==== | |||
<pre>ip access-list standard SNMP-RO | |||
permit <IPCollector> | |||
snmp-server community notsecure RO | |||
! | |||
! | |||
flow record recordCFLOW | |||
match ipv4 tos | |||
match ipv4 protocol | |||
match ipv4 source address | |||
match ipv4 source mask | |||
match ipv4 destination address | |||
match ipv4 destination mask | |||
match transport source-port | |||
match transport destination-port | |||
match interface input | |||
collect interface output | |||
collect routing source as | |||
collect routing destination as | |||
collect transport tcp flags | |||
collect counter bytes long | |||
collect counter packets long | |||
collect timestamp sys-uptime first | |||
collect timestamp sys-uptime last | |||
! | |||
! | |||
flow exporter exporterCFLOW | |||
destination <IPCollecor> | |||
source <SourceInterfaceForExports> | |||
transport udp 2055 | |||
template data timeout 300 | |||
! | |||
! | |||
flow monitor monitorCFLOW | |||
exporter exporternfv9 | |||
cache entries 60000 | |||
cache timeout active 60 | |||
cache timeout inactive 15 | |||
record recordnfv9</pre> | |||
==== Interface specific settings ==== | |||
<pre>interface GigabitEthernet1/1/1 | |||
bandwidth 20000 | |||
ip flow monitor monitorCFLOW input | |||
ip flow monitor monitorCFLOW output | |||
! | |||
! | |||
interface GigabitEthernet2/1/1 | |||
bandwidth 10000 | |||
ip flow monitor monitorCFLOW input | |||
ip flow monitor monitorCFLOW output</pre> | |||
| |||
=== Fortinet NetFlow Configuration Example === | |||
Let's assume that the router in the previous example is now a Fortigate NG Firewall. | |||
Fortinet defaults to NetFlow version 9. It can be configured for the firewall as a whole or per Virtual Domain. In this example we configure the firewall for flow exports. | |||
==== Global settings ==== | |||
<pre>config system netflow | |||
set collector-ip <IPCollector> | |||
set collector-port 2055 | |||
set source-ip <SourceInterfaceForExports> | |||
set active-flow-timeout 1 | |||
set inactive-flow-timeout 15</pre> | |||
==== Interface specific settings ==== | |||
<pre>config system interface | |||
edit wan1 | |||
set inbandwidth 20000 | |||
set outbandwidth 20000 | |||
set netflow-sampler both | |||
end | |||
config system interface | |||
edit wan2 | |||
set inbandwidth 10000 | |||
set outbandwidth 10000 | |||
set netflow-sampler both | |||
end</pre> | |||
| |||
Latest revision as of 16:34, 24 November 2020
Introduction
Correct configuration of Flow Exporting Devices (FED) is key to Flow Based Network Analysis. Mistakes made during configuration will result in missing and duplicated data. They are difficult to identify. Vendors of network equipment are not making it easy as many of them are using some sort of proprietary method to enable flow export on their devices.
Furthermore, Flow Collector (FC) and FED must allign on configuration parameters in order to interpret the records correctly.
This article creates a vendor independant framework to configure flow exports. We hope it will help you to confgure your FED.
We ask you kindly to read the entire article and not to jump to the confuration examples towards the end.
For a complete overview of IP Flow Information eXchange (IPFIX), we recommend reading RFC 3917.
If you come aware of vendor specific issues thay may help others, please let us know.
Solution
Definitions
First, let us make sure we speak the same language.
Flow Enabled Device or Flow Exporter
Flow Enabled Device of Flow Exporter is a device configured to send flow records to one or more collectors. This can be a L2 or L3 device.
Flow or IP Flow
Flow is formed by all packets between two TCP/IP sockets. Therefore, what we call a TCP sessions consists of two flows: one flow from client to server and the second flow from server to client.
Flow record
Flow record contains information about a specific flow that was metered at an observation point. A flow record contains measured properties aggregated for the flow. Key record fields are source and destination IP addess, protocol, source and destination port, number of bytes, number of packets, duration and input and output interfaces. There could be many more.
Sensor
Sensor is a metering point in the device. Sensors are associated with interfaces. It will quantify and qualify packets in or out of that interface, leading to the creation of a flow record decribing the flow. It is very important to realize a sensor will measure packets in one direction only (ingress or egress).
Collector
Flow collector is a server application that receives the flow records and stores them in a database. In TruView, TruView Flow is the collector. In nGeniusONE, the Flow Collector is the collector. The sizeof the hardware will depend on the number of flows received per second and the aging time of the "raw" flow records.
Reporter
Flow reporter is a server application mining the data records, producing tables and charts and possibly alerts. In TruView, TruView Central is the reporter. In nGeniusONE, nGenius Server is the reporter. When the number of flows received per second is low (<50k/s), collector and reporter can be installed on the same hardware.
Global configuration
The way to enable flow monitoring and flow exports will vary from vendor to vendor. In general there are two major portions. In Global Setting you set parameters on the flow and the export mechanism itself. Interface Settings let you decide where to deploy sensors so that all flows through the device are accounted for.
Destination
- IP address of the collector
Port
- UDP port where the collector is listening on
Active flow timeout
- Interval at which flow record updates are send in case of long flows. A flow is considered long when it exceeds the smallest database granularit. Consequently, this setting should match the smallest granularity of the database on the collector. In most cases, this is one minute or 60 seconds.
Inactive flow timeout
- Interval of inactivity (no packets) that marks a flow as inactive. The recommended setting is 15 seconds.
Flow record format
With the introduction of CISCO Flexible NetFlow and the standardization of IPFIX, the PDU of a flow record is no longer uniquely defined. The fields contained in the PDU should match the reporter's capabilities of reporting on the value represented in that field. These fields should be present at all times:
- source address
- destination address
- type of service
- protocol
- source port
- destination port
- input interface
- output interface
- tcp flags
- number of bytes
- number of packets
- timestamp of the first packet of the flow
- timestamp of the last packet of the flow
Additional fields may be required in case of sampling or to help indicating the in and out interfaces on a L2 device.
Interface configuration
| If this is your first experience with configuring flow export on network devices, we recommend you make a drawing of the device, its interfaces (physical and virtual) and every flow that goes through the device. |
Basically, this is the science of deploying sensors so that EVERY flow that goes through the device is metered once and NO flow is metered more than once.
Example 1: ingress sensor on all interfaces
Flows from user to network are metered by the ingress sensor on interface 0/0 while flows from network to user are metered by the ingress sensor on interface 0/1. If the device has more than two active interfaces, deploy ingress sensors on all these interface.
Example 2: egress sensor on all interfaces
Flows from user to network are metered by the egress sensor on interface 0/1 while flows from network to user are metered by the egress sensor on interface 0/0. If the device has more than two active interfaces, deploy egress sensors on all these interface.
Example 3 and 4: ingress and egress sensors on some interfaces
In example 3, flows from user to network are metered by the ingress/in sensor on interface 0/0. Flows from network to user are metered by the egress sensor on that same interface 0/0. This configuration is prefrerable when interface 0/1 is complex like a composed of a multitude of virtual interfaces. In some vendors it may also be required when the network side is a tunnel interface.
It is the method preferred by network service providers as they only "care" about the wide area interface. In that case, sensors will be deployed on the network side of the router.
As a general rule of thumb, this method should not be used on more than one interfaces when these are carying the same flow.
Cisco NetFlow Configuration Example
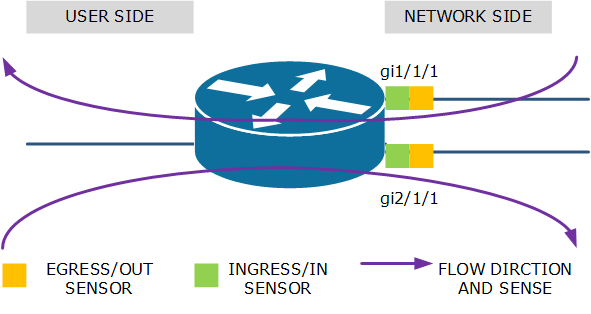
This is how Flexible NetFlow configuration (without sampling) would look on a CISCO 4000 Series ISR router with a recent IOS. The router has two physical interfaces (20 and 10Mbps) facing the network. At no point in time there is traffic between these two interfaces.
To avoid manual set-up of the interfaces in the collector, the collector must be able to discover the device's configuration using SNMP (read-only). Also, you need to set the correct speed (unspecified line rate or commited interface rate) for the circuits behind the physical interfaces to allow correct calculation of interface utilization.
On devices handling a lot of traffic, you may be required to increase the size of the cache. This will consume additional memory on the device.
Global settings
ip access-list standard SNMP-RO
 permit <IPCollector>
snmp-server community notsecure RO
!
!
flow record recordCFLOW
 match ipv4 tos
 match ipv4 protocol
 match ipv4 source address
 match ipv4 source mask
 match ipv4 destination address
 match ipv4 destination mask
 match transport source-port
 match transport destination-port
 match interface input
 collect interface output
 collect routing source as
 collect routing destination as
 collect transport tcp flags
 collect counter bytes long
 collect counter packets long
 collect timestamp sys-uptime first
 collect timestamp sys-uptime last
!
!
flow exporter exporterCFLOW
 destination <IPCollecor>
 source <SourceInterfaceForExports>
 transport udp 2055
 template data timeout 300
!
!
flow monitor monitorCFLOW
 exporter exporternfv9
 cache entries 60000
 cache timeout active 60
 cache timeout inactive 15
 record recordnfv9
Interface specific settings
interface GigabitEthernet1/1/1
 bandwidth 20000
 ip flow monitor monitorCFLOW input
 ip flow monitor monitorCFLOW output
!
!
interface GigabitEthernet2/1/1
 bandwidth 10000
 ip flow monitor monitorCFLOW input
 ip flow monitor monitorCFLOW output
Fortinet NetFlow Configuration Example
Let's assume that the router in the previous example is now a Fortigate NG Firewall.
Fortinet defaults to NetFlow version 9. It can be configured for the firewall as a whole or per Virtual Domain. In this example we configure the firewall for flow exports.
Global settings
config system netflow
      set collector-ip <IPCollector>
      set collector-port 2055
      set source-ip <SourceInterfaceForExports>
      set active-flow-timeout 1
      set inactive-flow-timeout 15
Interface specific settings
config system interface
       edit wan1
             set inbandwidth 20000
             set outbandwidth 20000
             set netflow-sampler both
       end
config system interface
       edit wan2
             set inbandwidth 10000
             set outbandwidth 10000
             set netflow-sampler both
       end