Attenuation signal reduction to dB: Difference between revisions
Jump to navigation
Jump to search
No edit summary |
No edit summary |
||
| Line 52: | Line 52: | ||
| style="text-align: center" | 96.8% | | style="text-align: center" | 96.8% | ||
|} | |} | ||
| |||
| | ||
Revision as of 12:48, 9 March 2019
Introduction
Many fiber optic technicians are unfamiliar with logarithmic scales and units such as decibel (dB).
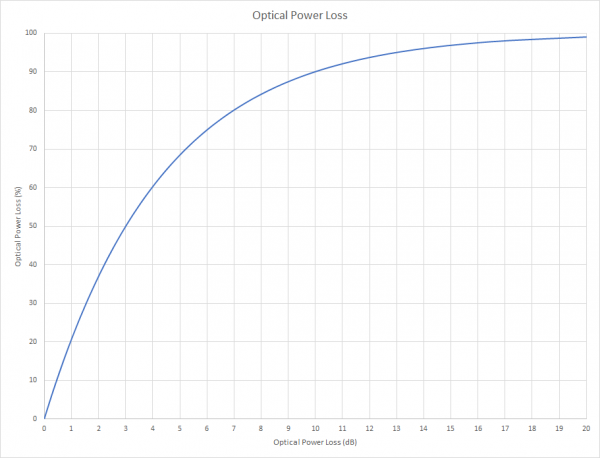
This table allows you to get a grasp on the relationship between loss on a logartimic scale (dB) and optical power reduction on a liniar scale (%).
Solution
Table
| Attenuation | Optical Power Reduction |
|---|---|
| 0 dB | 0% |
| 1 dB | 21% |
| 2 dB | 37% |
| 3 dB | 50% |
| 4 dB | 60% |
| 5 dB | 68% |
| 6 dB | 75% |
| 7 dB | 80% |
| 10 dB | 90% |
| 13 dB | 95% |
| 15 dB | 96.8% |
Graph
